10.3 Measuring the sound level (Lp) (measurement state)
Measure the sound level.
1Touch [Menu] on the measurement screen.
![Touch [Menu] on the measurement screen.](../images/10/03_img_1.png)
The [Menu] screen appears.
2Touch [Measure] on the [Menu] screen.
![Touch [Measure] on the [Menu] screen.](../images/10/03_img_2.png)
The [Measure] screen appears.
3Touch [Frequency Weighting] on the [Measure] screen.
![Touch [Frequency Weighting] on the [Measure] screen.](../images/10/03_img_3.png)
The [Frequency Weighting] screen appears.
Note
- The [Frequency Weighting] screen can also be displayed by touching [Freq. Weight] on the menu ring.
4Touch the channel to use, and select the frequency weighting.
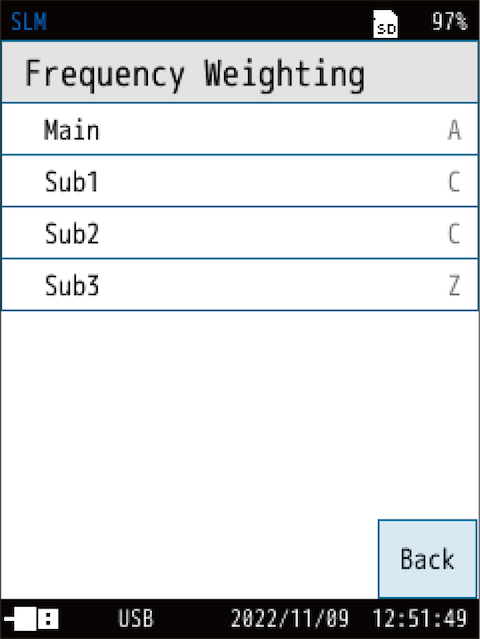
When measuring according to a standard such as JIS, set the time weighting according to the corresponding standard.
| Item | Description |
|---|---|
| A | Sets A-weighting. |
| C | Sets C-weighting. |
| Z | Sets Z-weighting. |
For details on each item, see “Frequency Weighting”.
5Return to the [Measure] screen, and touch [Time Weighting].
![Return to the [Measure] screen, and touch [Time Weighting].](../images/10/03_img_5.png)
The [Time Weighting] screen appears.
6Touch the channel to use, and select the time weighting.
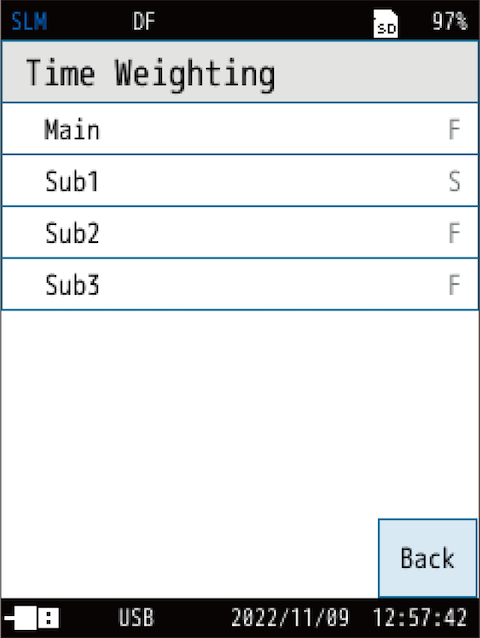
When measuring according to a standard such as JIS, set the time weighting according to the corresponding standard.
| Item | Description |
|---|---|
| F | Sets F (fast). |
| S | Sets S (slow). |
| I |
Sets I (impulse). |
Note
- The device uses high-speed sampling (20.8 µs) data for the sound pressure waveforms of Leq, LE and Lpeak calculation, and so it is not affected by time weighting.
7Return to the [Menu] screen, and touch [Display].
![Return to the [Menu] screen, and touch [Display].](../images/10/03_img_7.png)
The [Display] screen appears.
8Touch [Bar Graph] on the [Display] screen.
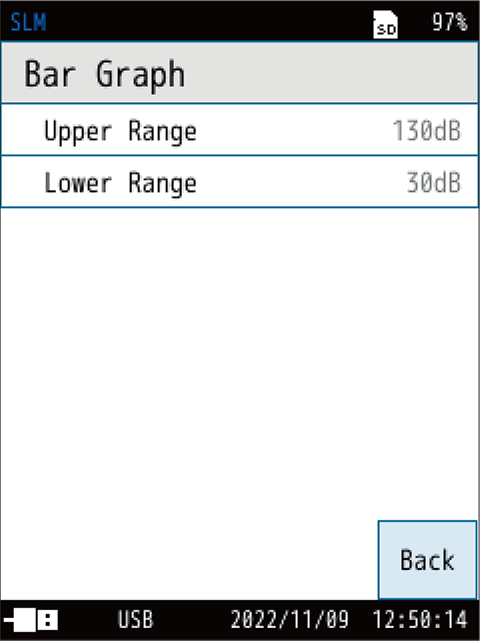
![Touch [Bar Graph] on the [Display] screen.](../images/10/03_img_8.png)
The [Bar Graph] screen appears.
9Set the upper and lower limits of the bar graph.
| Item | Description |
|---|---|
| Upper Range | Select the upper limit (dB) of the bar graph. The value that can be set is 70 dB to 130 dB in 10 dB increments. |
| Lower Range | Select the lower limit (dB) of the bar graph. The value that can be set is 20 dB to 60 dB in 10 dB increments. |
Note
- The [Bar Graph] screen can also be displayed by touching [Range] on the menu ring.
- The default setting of 30 dB to 130 dB will suffice if neither AC output, DC output, nor waveform recording function (when NX-43WR is installed) is used.
- To make the bar graph display easier to see, set the upper and lower limits of the bar graph so that the measured sound pressure level comes near the center of the graph.
10Touch [Back] or press the START/STOP key to return to the measurement screen.
11Press the START/STOP key to start the measurement.
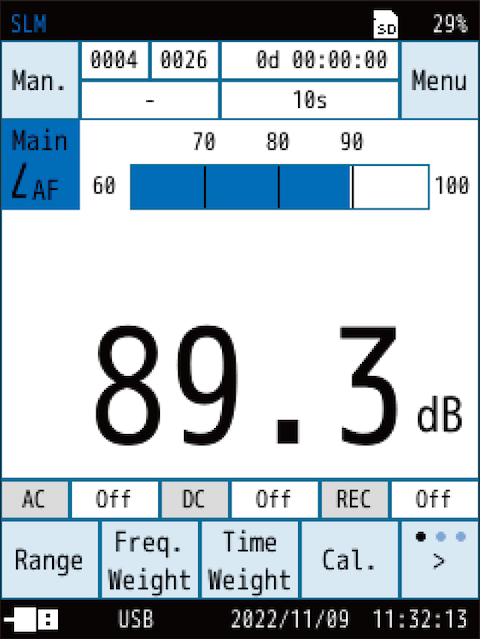
- The sound level Lpis displayed, and the bar graph is updated every 100 ms, and the level value is updated every 1 second.
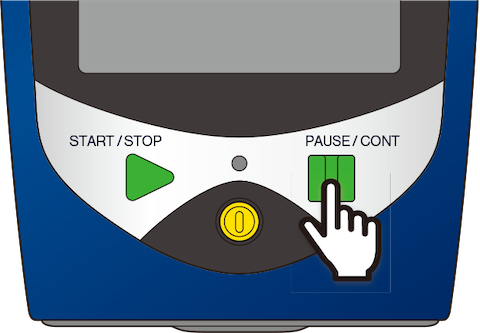
- The display can be paused and resumed by pressing the PAUSE/CONT key.
![When paused, [PAUSE] and “II” will flash on the screen.](../images/10/03_img_12.png)
- When paused, [PAUSE] and “II” will flash on the screen.
- The indicator LED flashes blue while paused.
- The bar graph display is updated even when paused.
- Touch [Lp store] on the menu ring to save the sound level (Lp).
12Press the START/STOP key to end the measurement.
To store the measurement data, refer to “Store Operations” .