6.3 Display
Sets the measurement amount and other items displayed on the measurement screen.
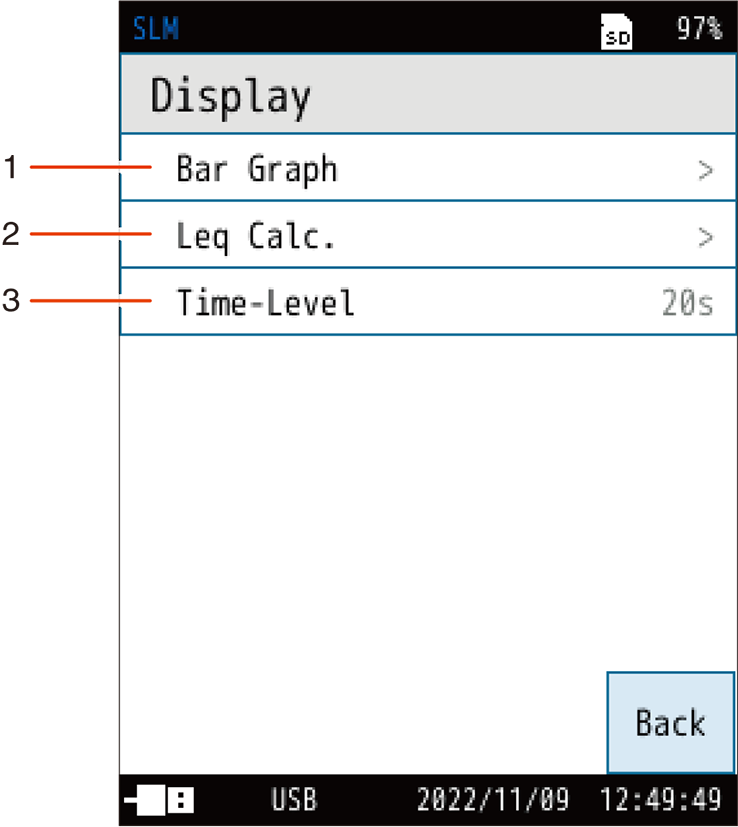
| No. | Name | Description |
|---|---|---|
| 1 | Bar Graph | Sets the upper and lower limits of the bar graph. |
| 2 | Leq Calc. | Sets the measurement amount to be displayed on the [Calculated value] screen. |
| 3 | Time-Level | Sets whether to display Time-Level. |
6.3.1 Bar Graph
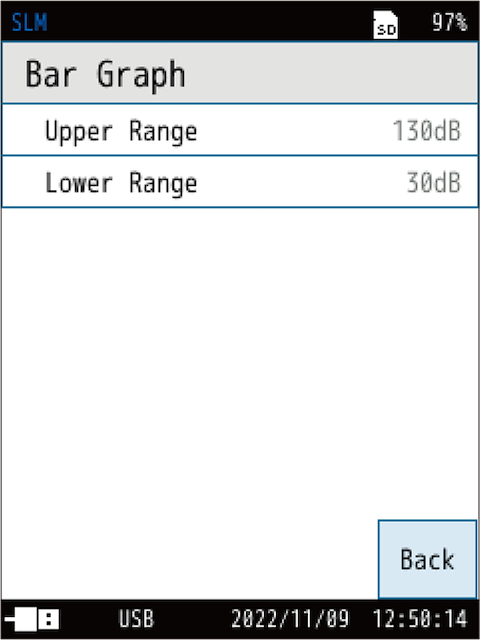
Sets the upper and lower limits of the bar graph.
| Item | Description |
|---|---|
| Upper Range | Select the upper limit (dB) of the bar graph. The value that can be set is 70 dB to 130 dB in 10 dB increments. |
| Lower Range | Select the lower limit (dB) of the bar graph. The value that can be set is 20 dB to 60 dB in 10 dB increments. |
6.3.2 Leq Calc.
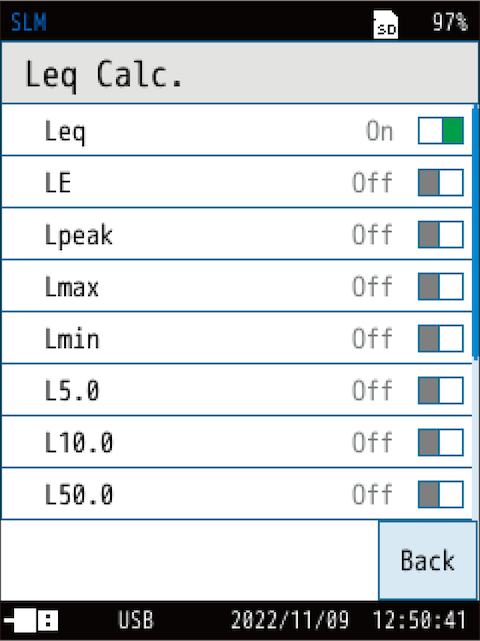
Sets the measurement amount to be displayed on the measurement screen.
The setting switches between turning on/off each time you touch.
Leq calculation (statistical calculation for a certain interval such as Leq, LE, Lmax, Lmin, Lpeak, LN, LIeq, Leq,mov and Ltm5) is measured at the same time. Turn on the calculated value you want to display.
| Item | Description |
|---|---|
| On | Displays the calculated value of the target on the measurement screen. |
| Off | Does not display the calculated value of the target on the measurement screen. |
Note
- Calculated values which is selected [Off] in this setting are measured and saved.
- Ltm5 calculation and back erase function cannot be set at the same time.
6.3.3 Time-Level
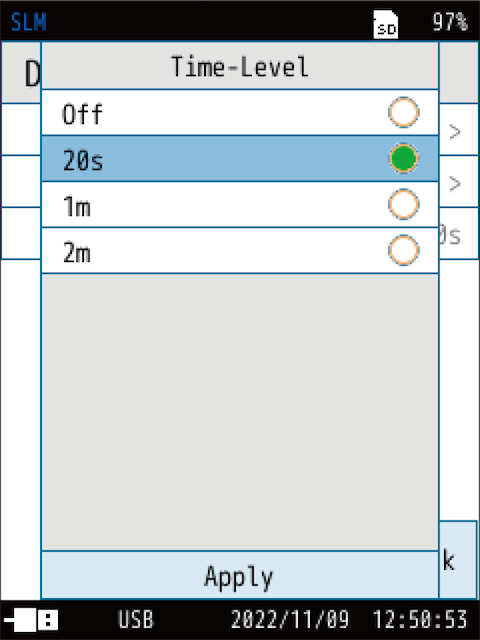
(s = seconds, m = minutes)
Sets whether to display Time-Level.
| Item | Description |
|---|---|
| Off | Does not display the [Time-Level] screen. |
| 20s | Displays the [Time-Level] screen. Select the screen horizontal axis (time). |
| 1m | |
| 2m |